A vibrant bar graph visualizes data trends with neon colors and a futuristic design
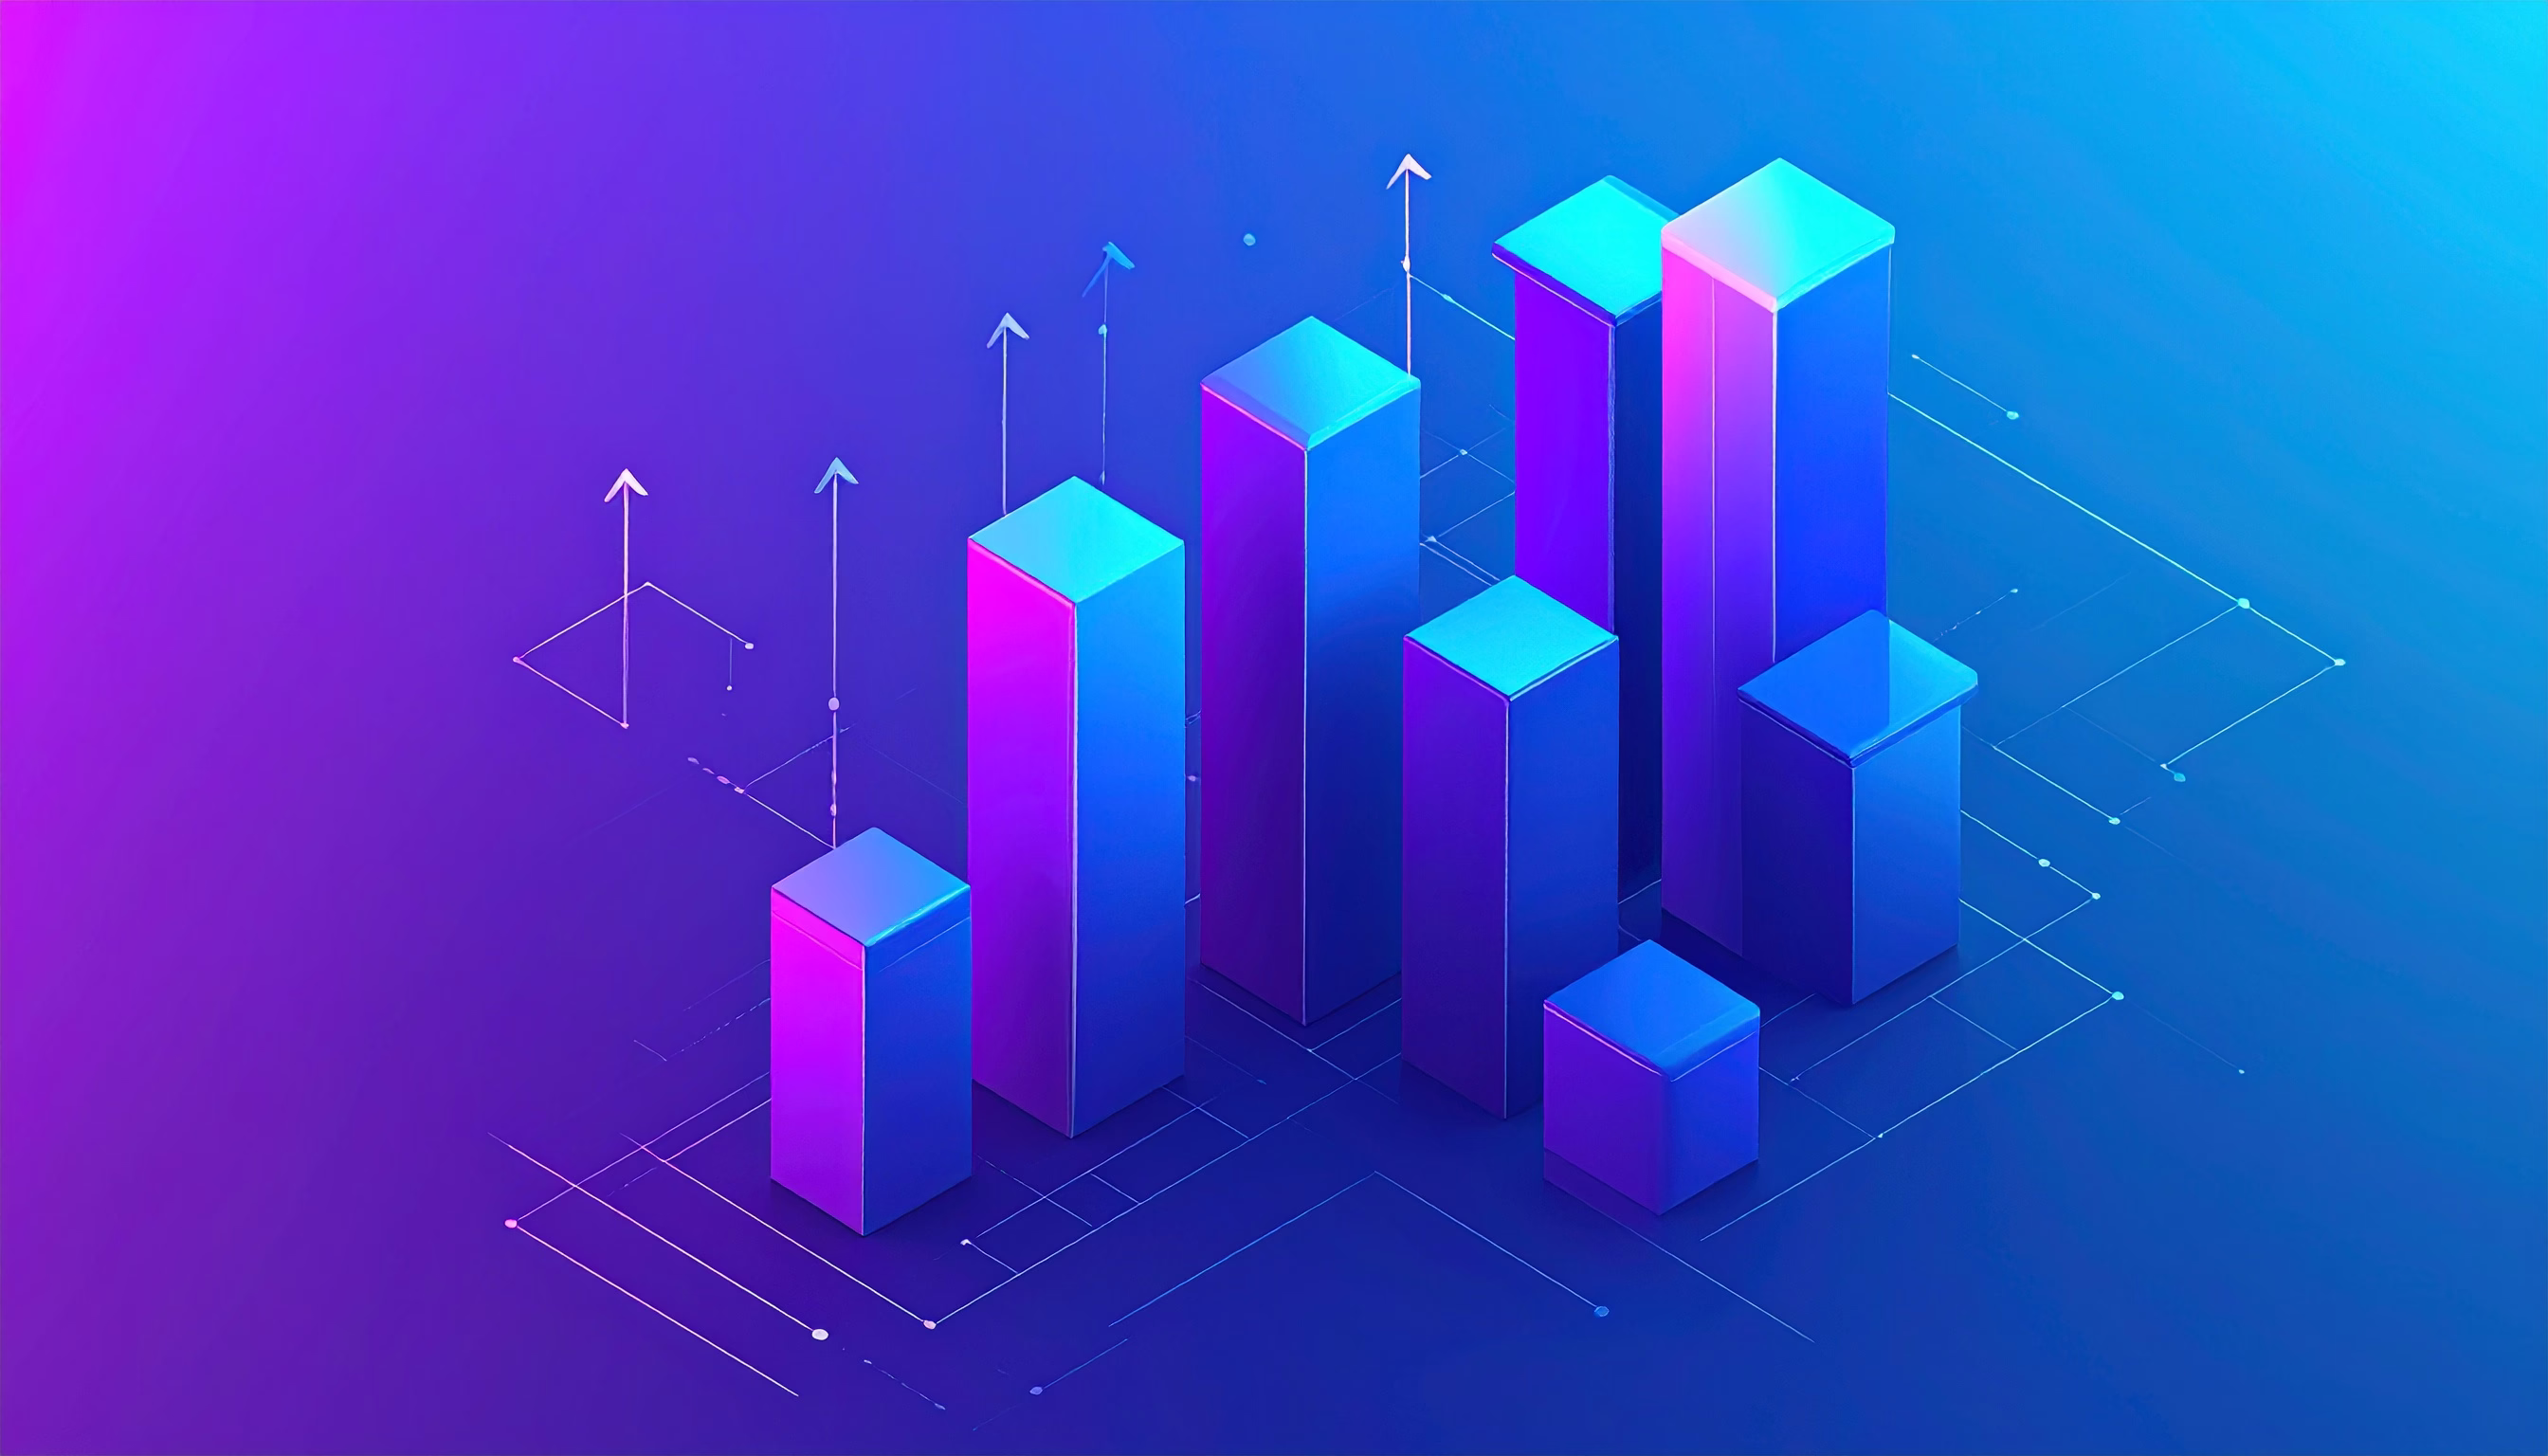
Ideal for presentations and reports, it conveys growth and progress effectively. The 3D bars in shades of blue and purple create a dynamic and engaging look. Perfect for business analytics and digital...
| Dimensions | 2688 × 1536 px |
| Size | 716.9 KB |
| Format | image/jpeg |
| Added | 25 de novembro de 2025 |
$0.20
Lifetime Access
Related Images
Smartwatch with a sleek design displayed on a futuristic background
A mesmerizing digital landscape showcases vibrant neon waves in purple and blue

A person in a red coat descends a spiral staircase, creating a striking contrast against
A digital representation of an AI brain surrounded by futuristic neon graphics

Silhouette of a man smoking against a vibrant gradient background
Collection
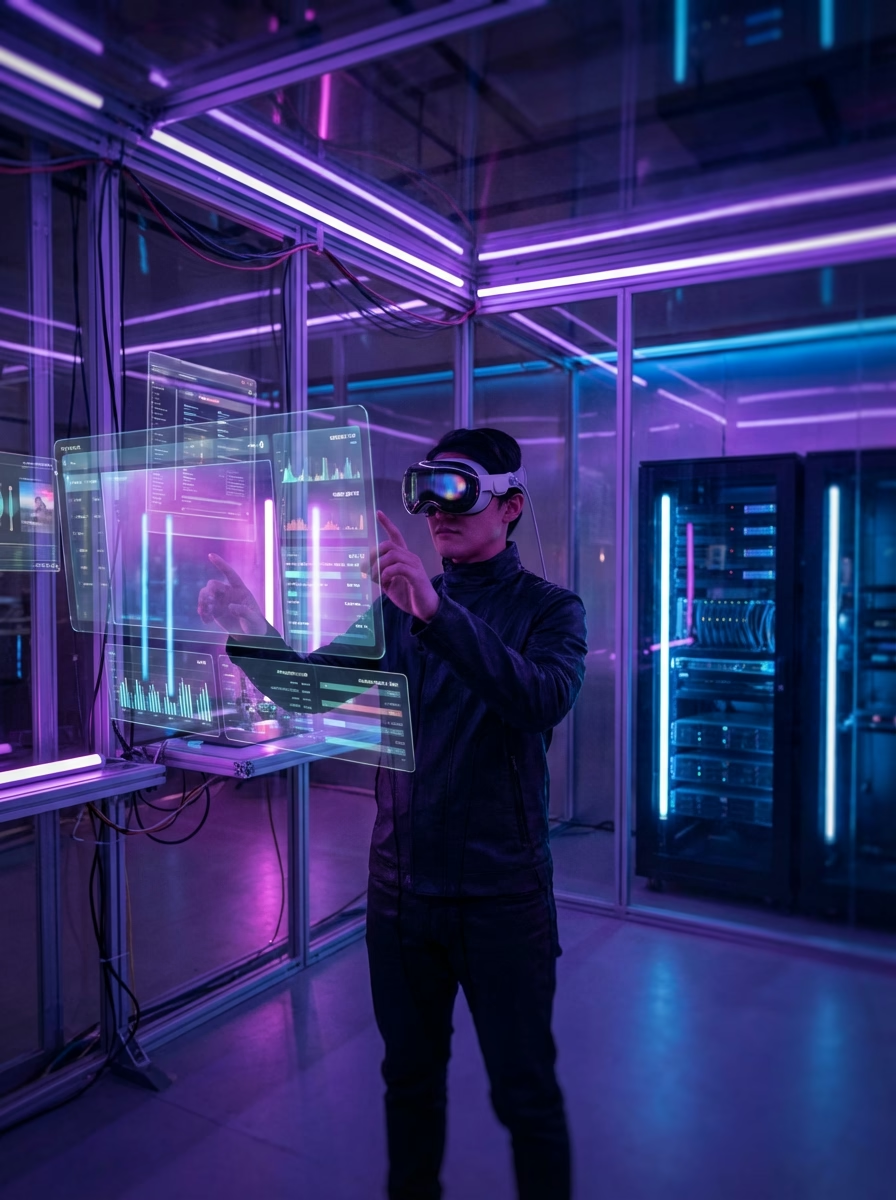
A person wearing VR goggles interacts with holographic data screens in a futuristic setting
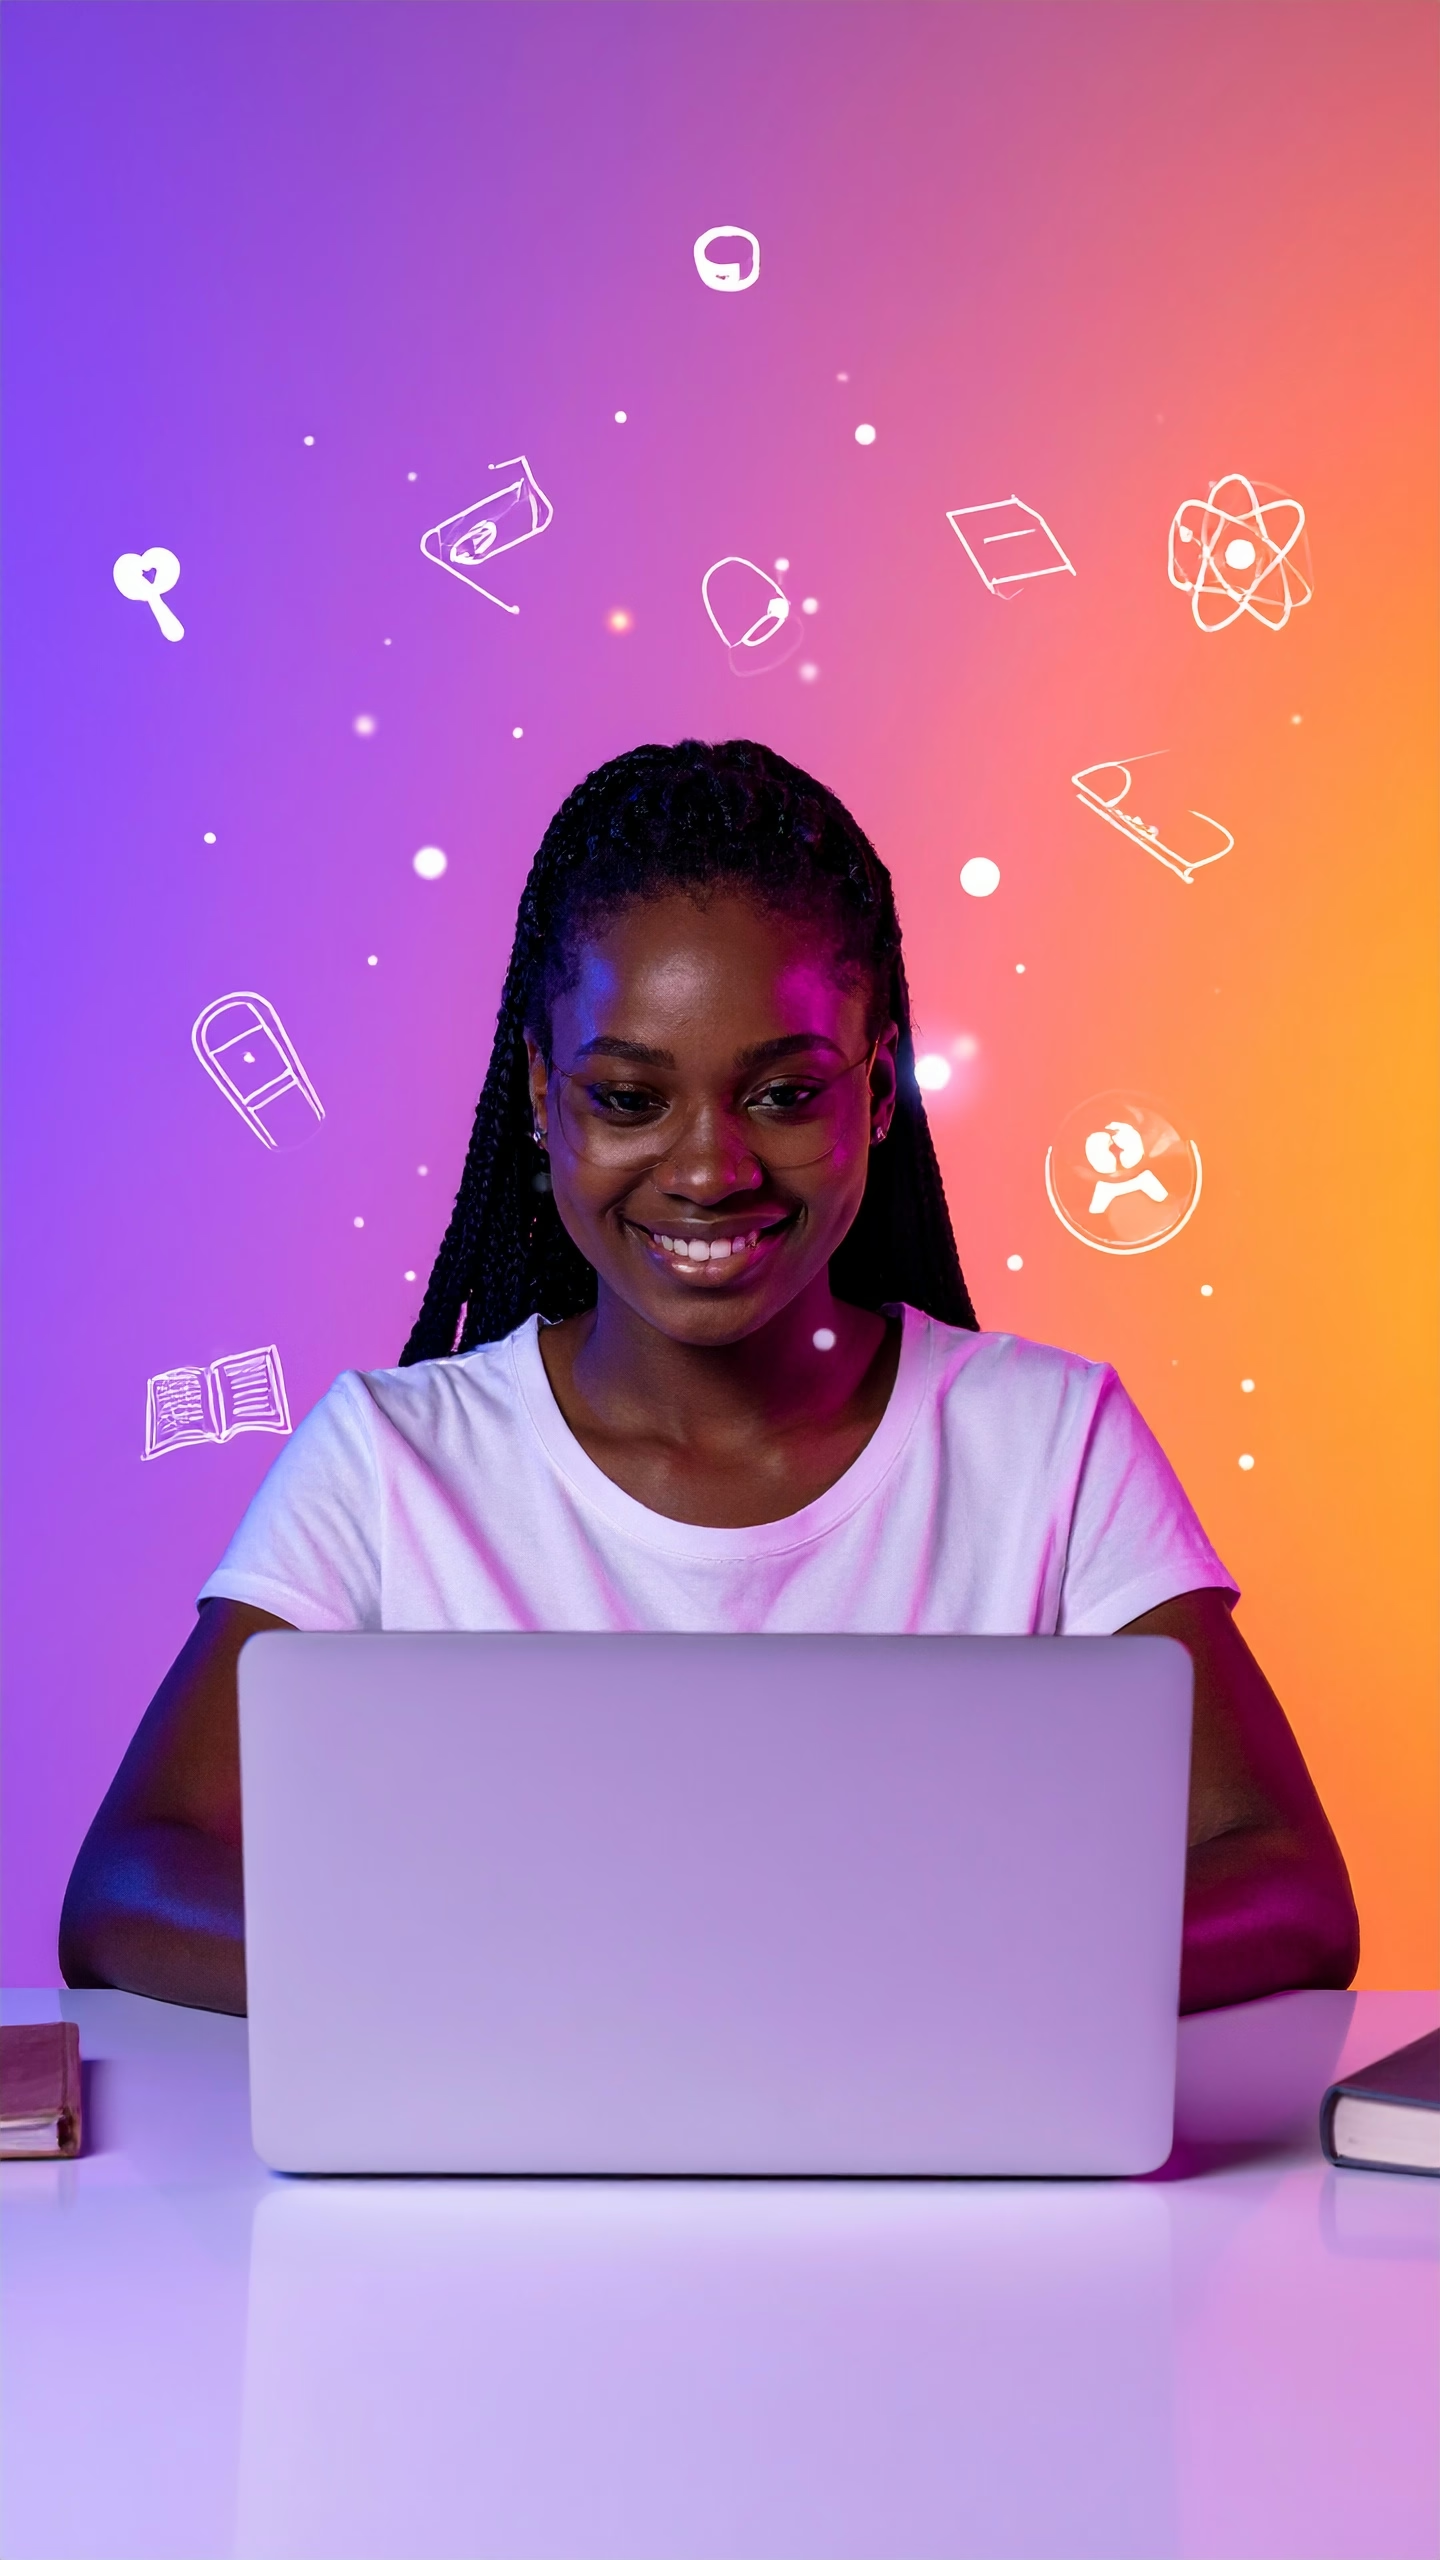
A woman is using a laptop against a vibrant gradient background
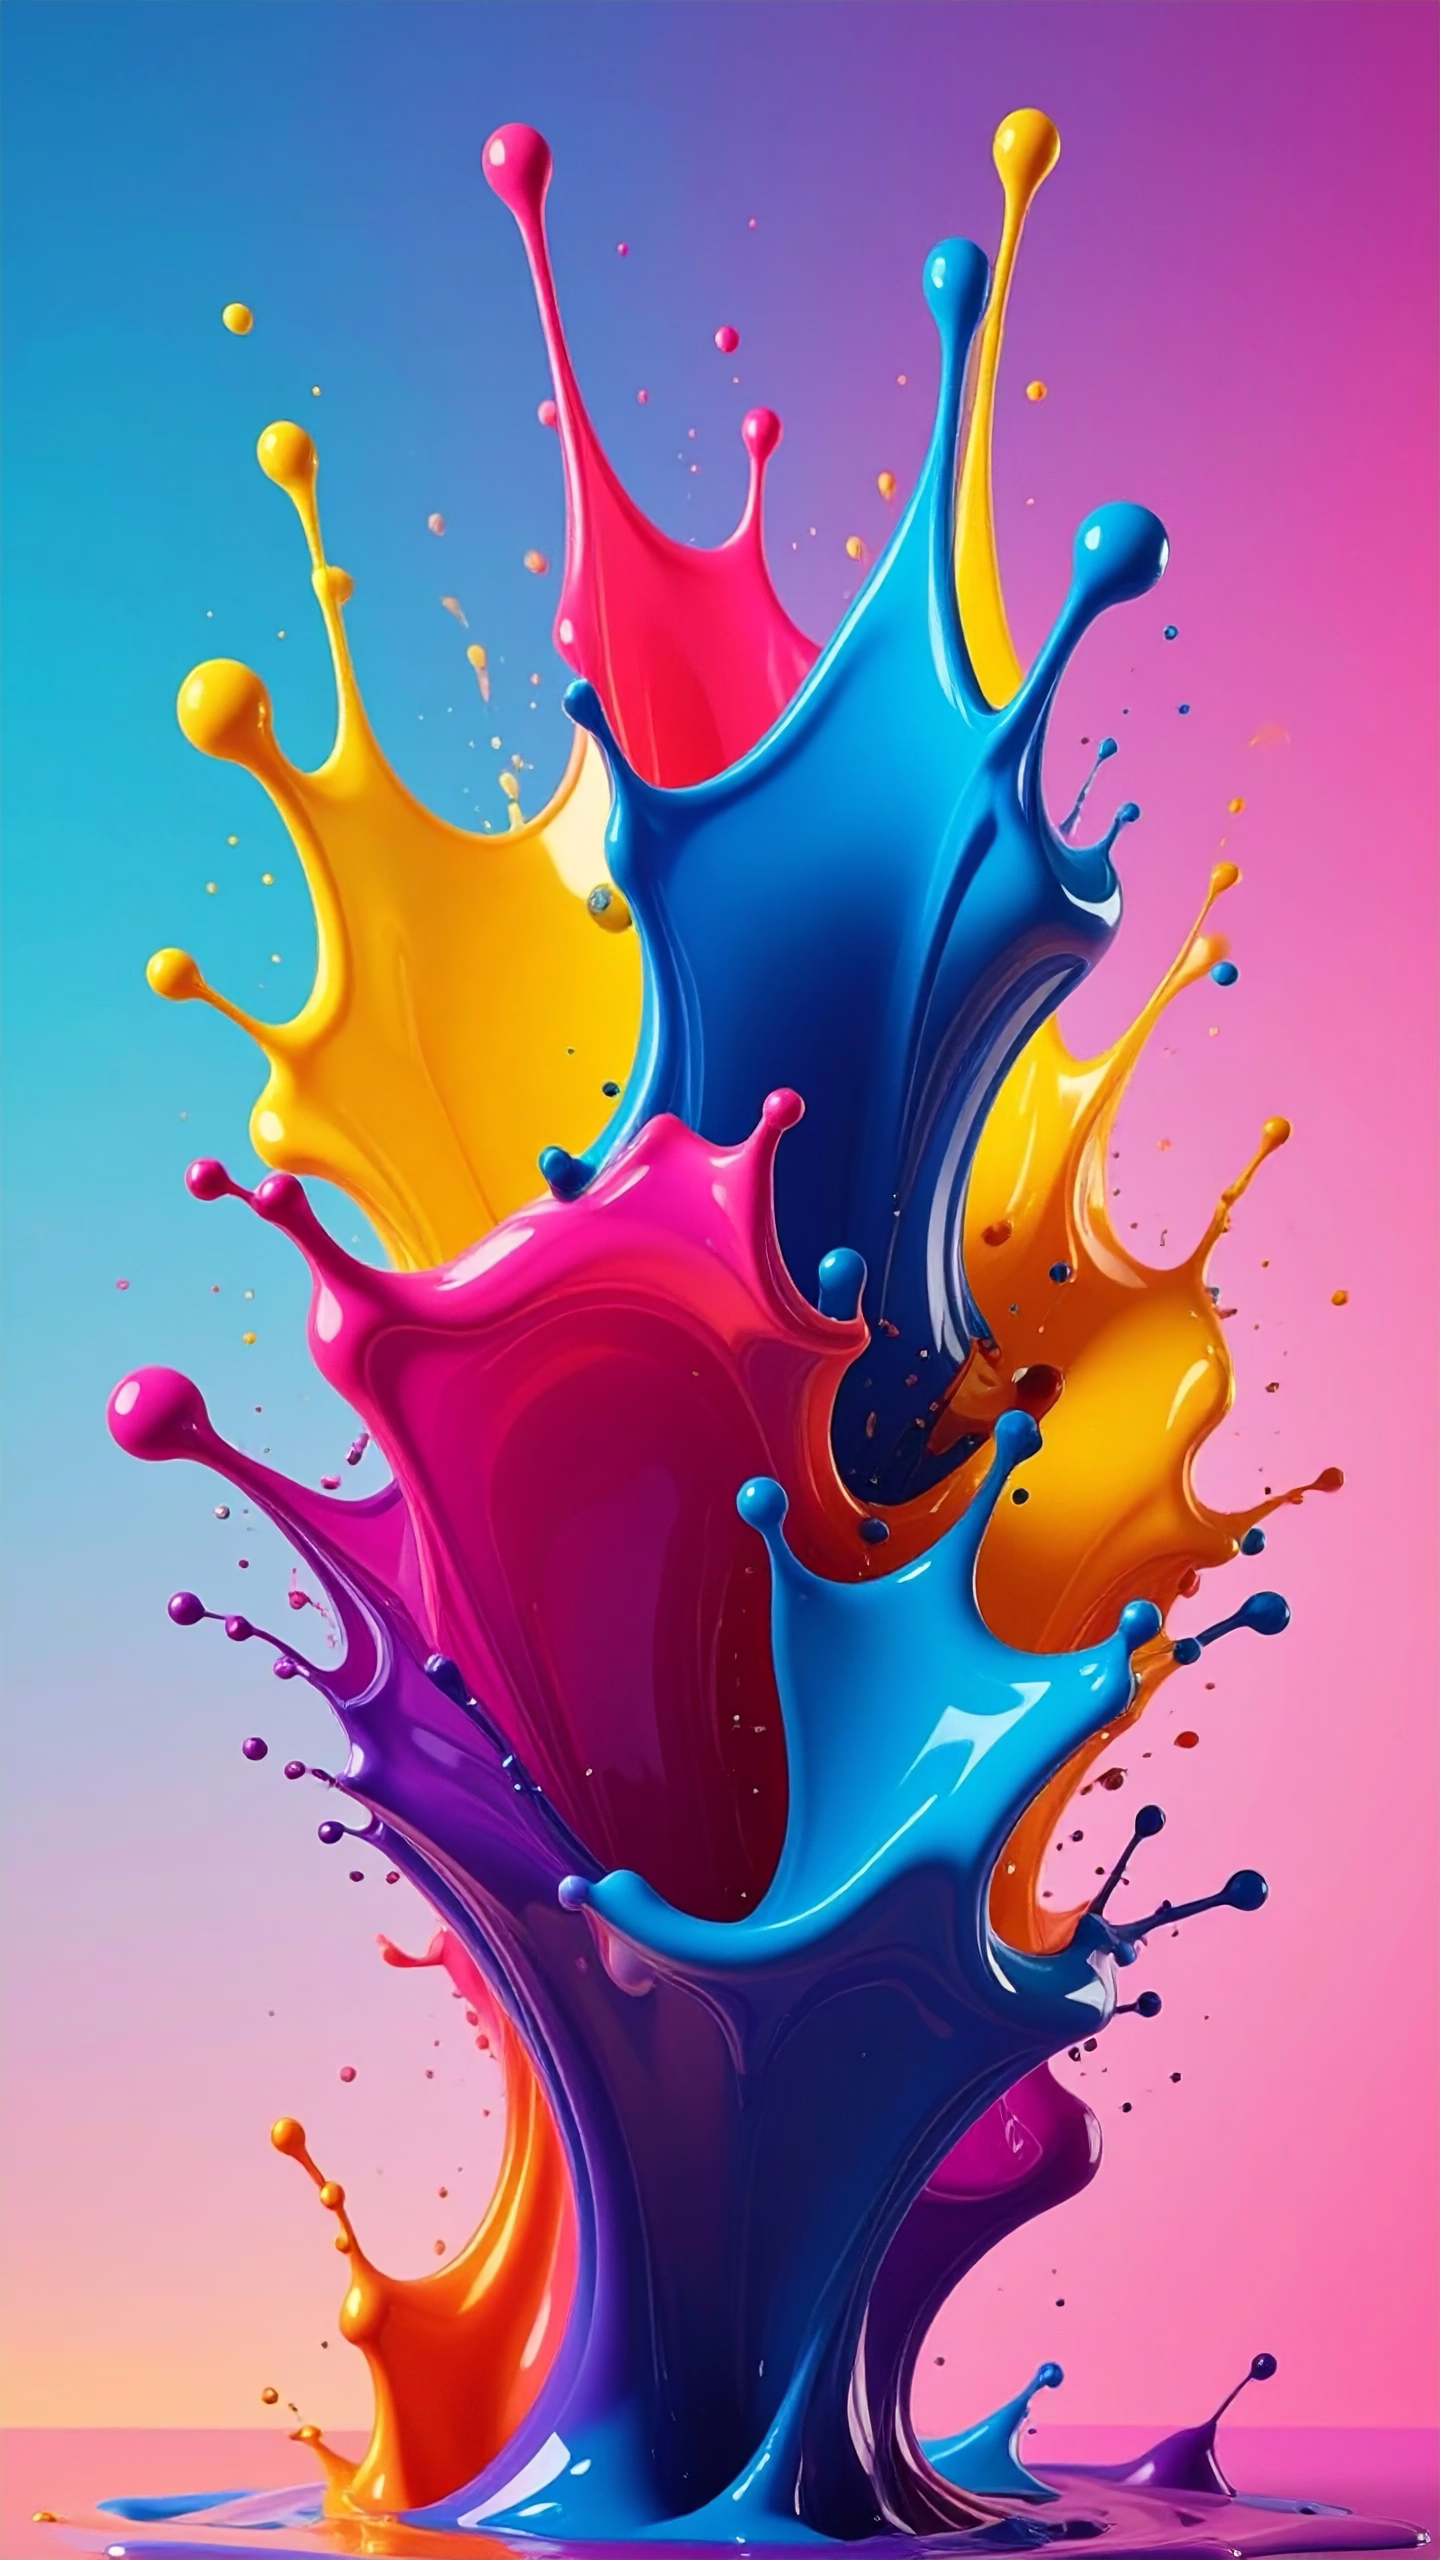
A vibrant splash of multicolored paint erupts against a gradient background
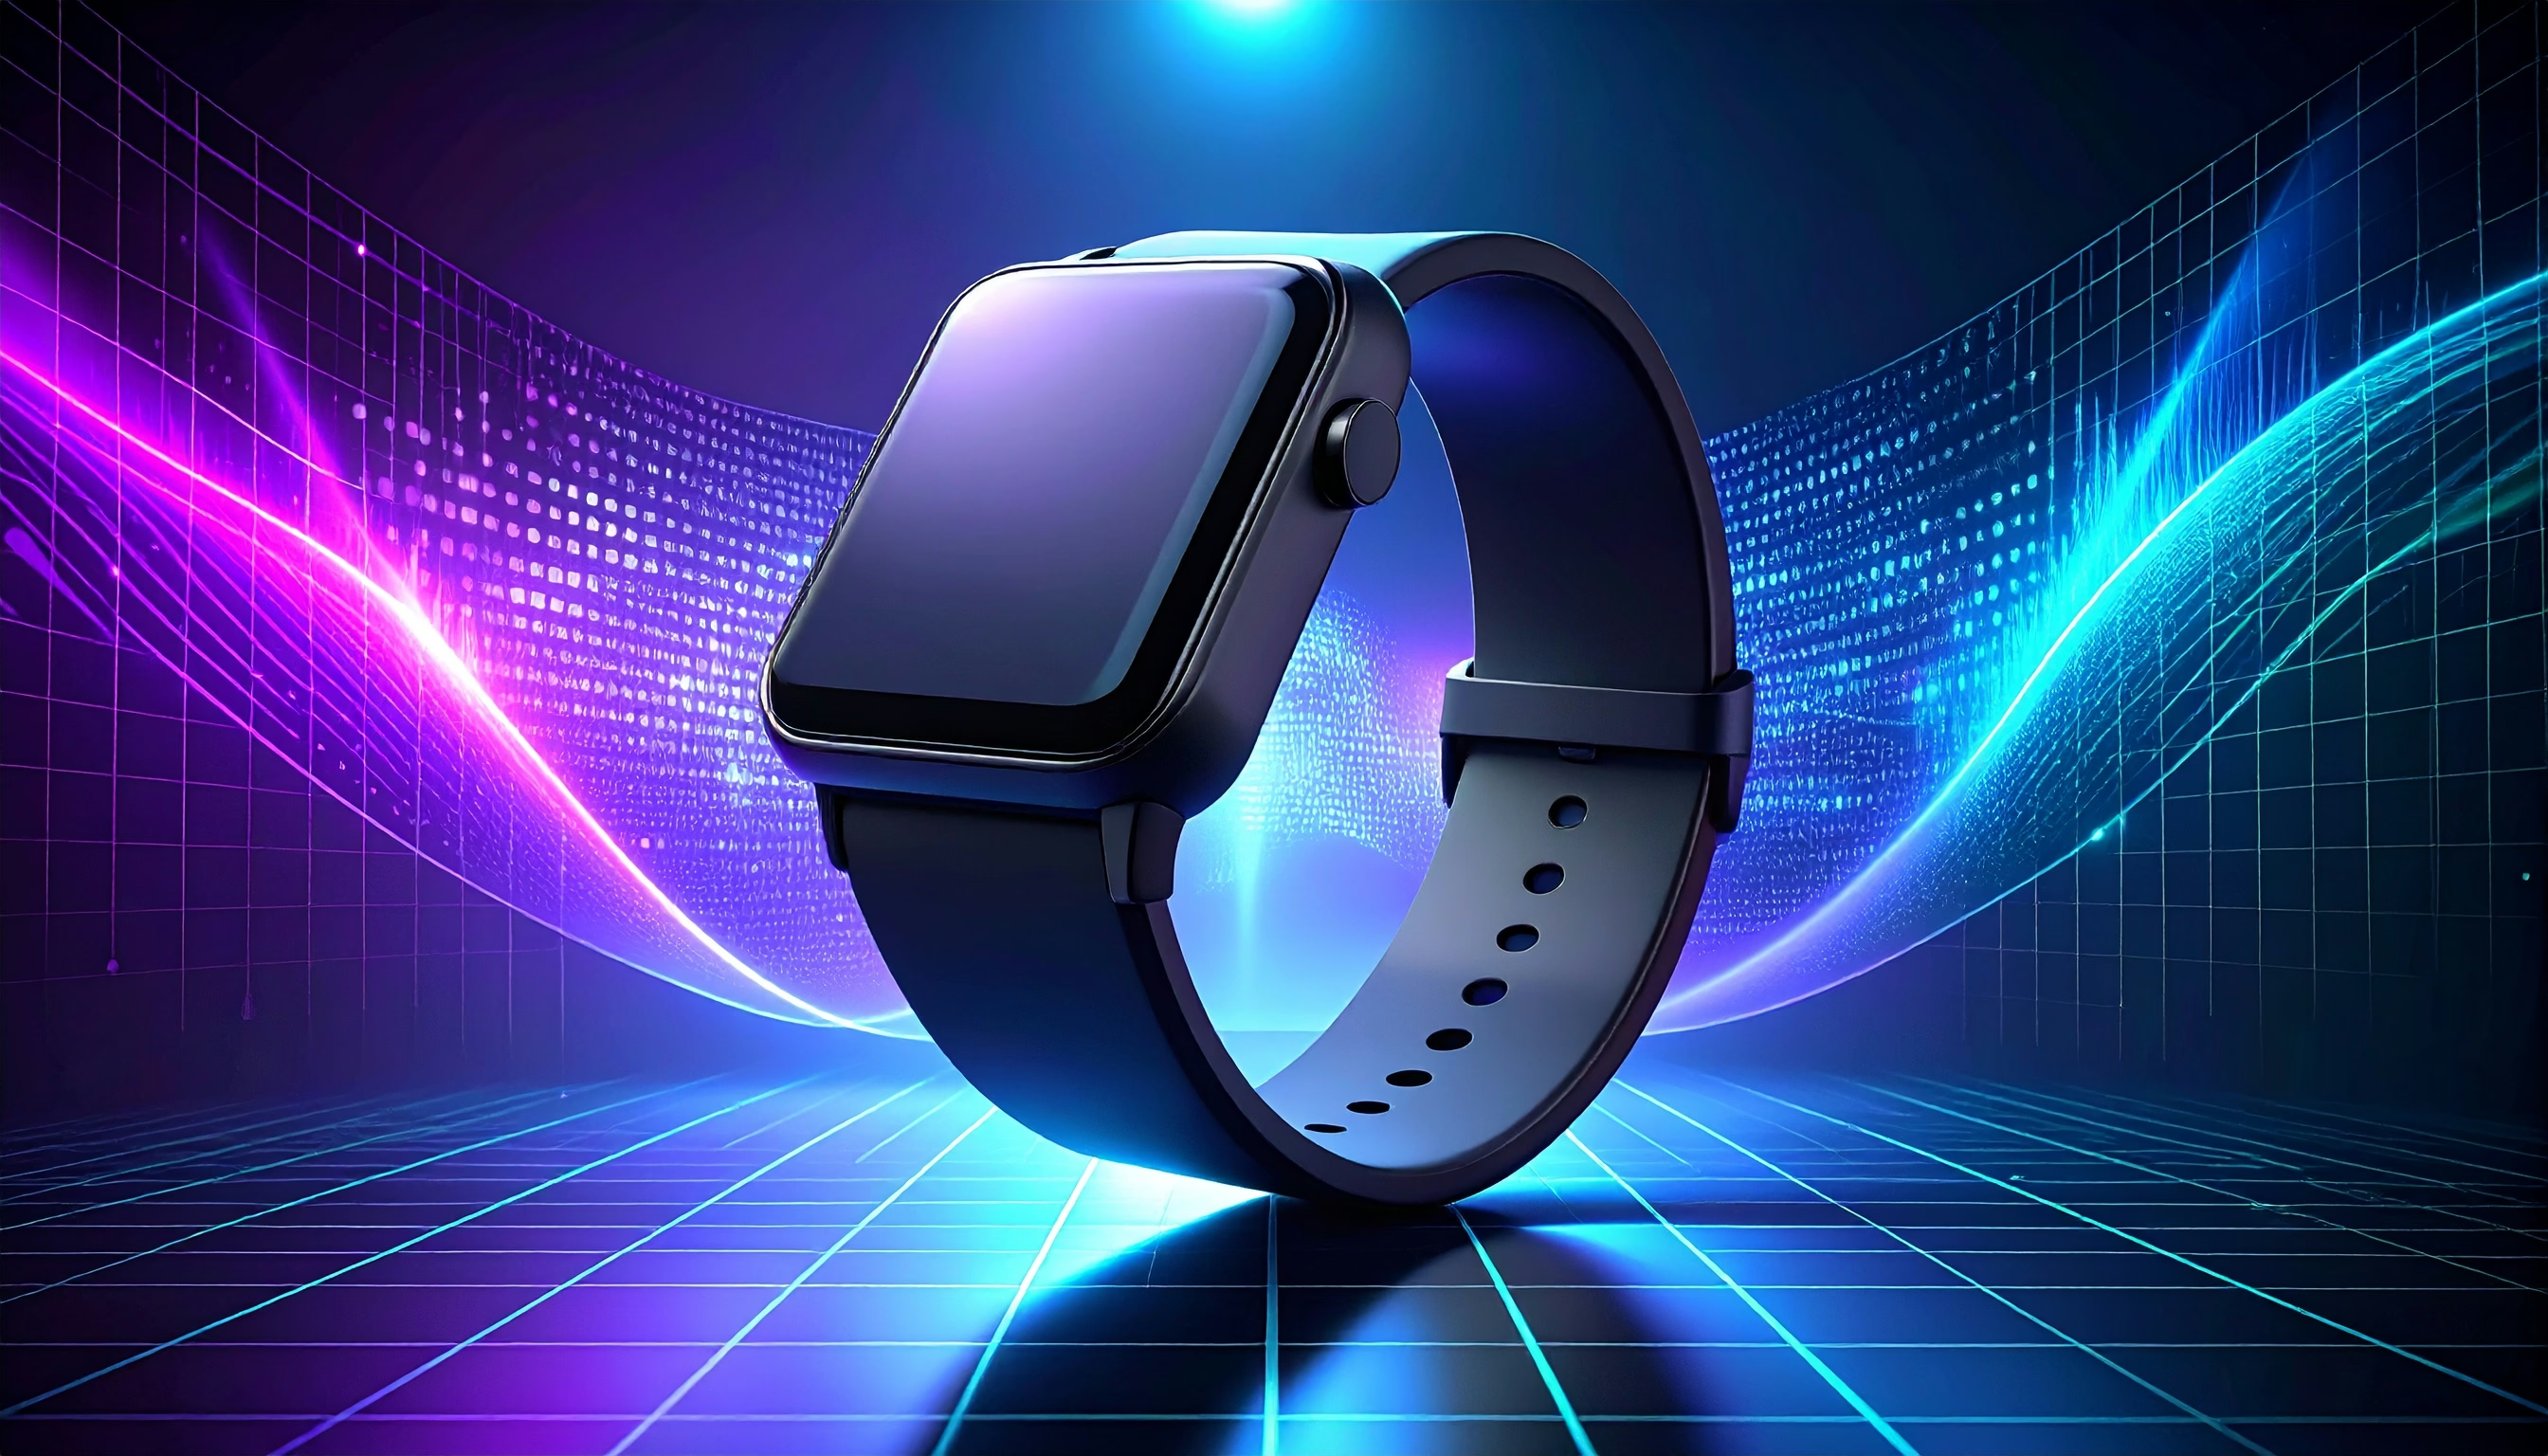
A sleek black smartwatch set against a vibrant digital background
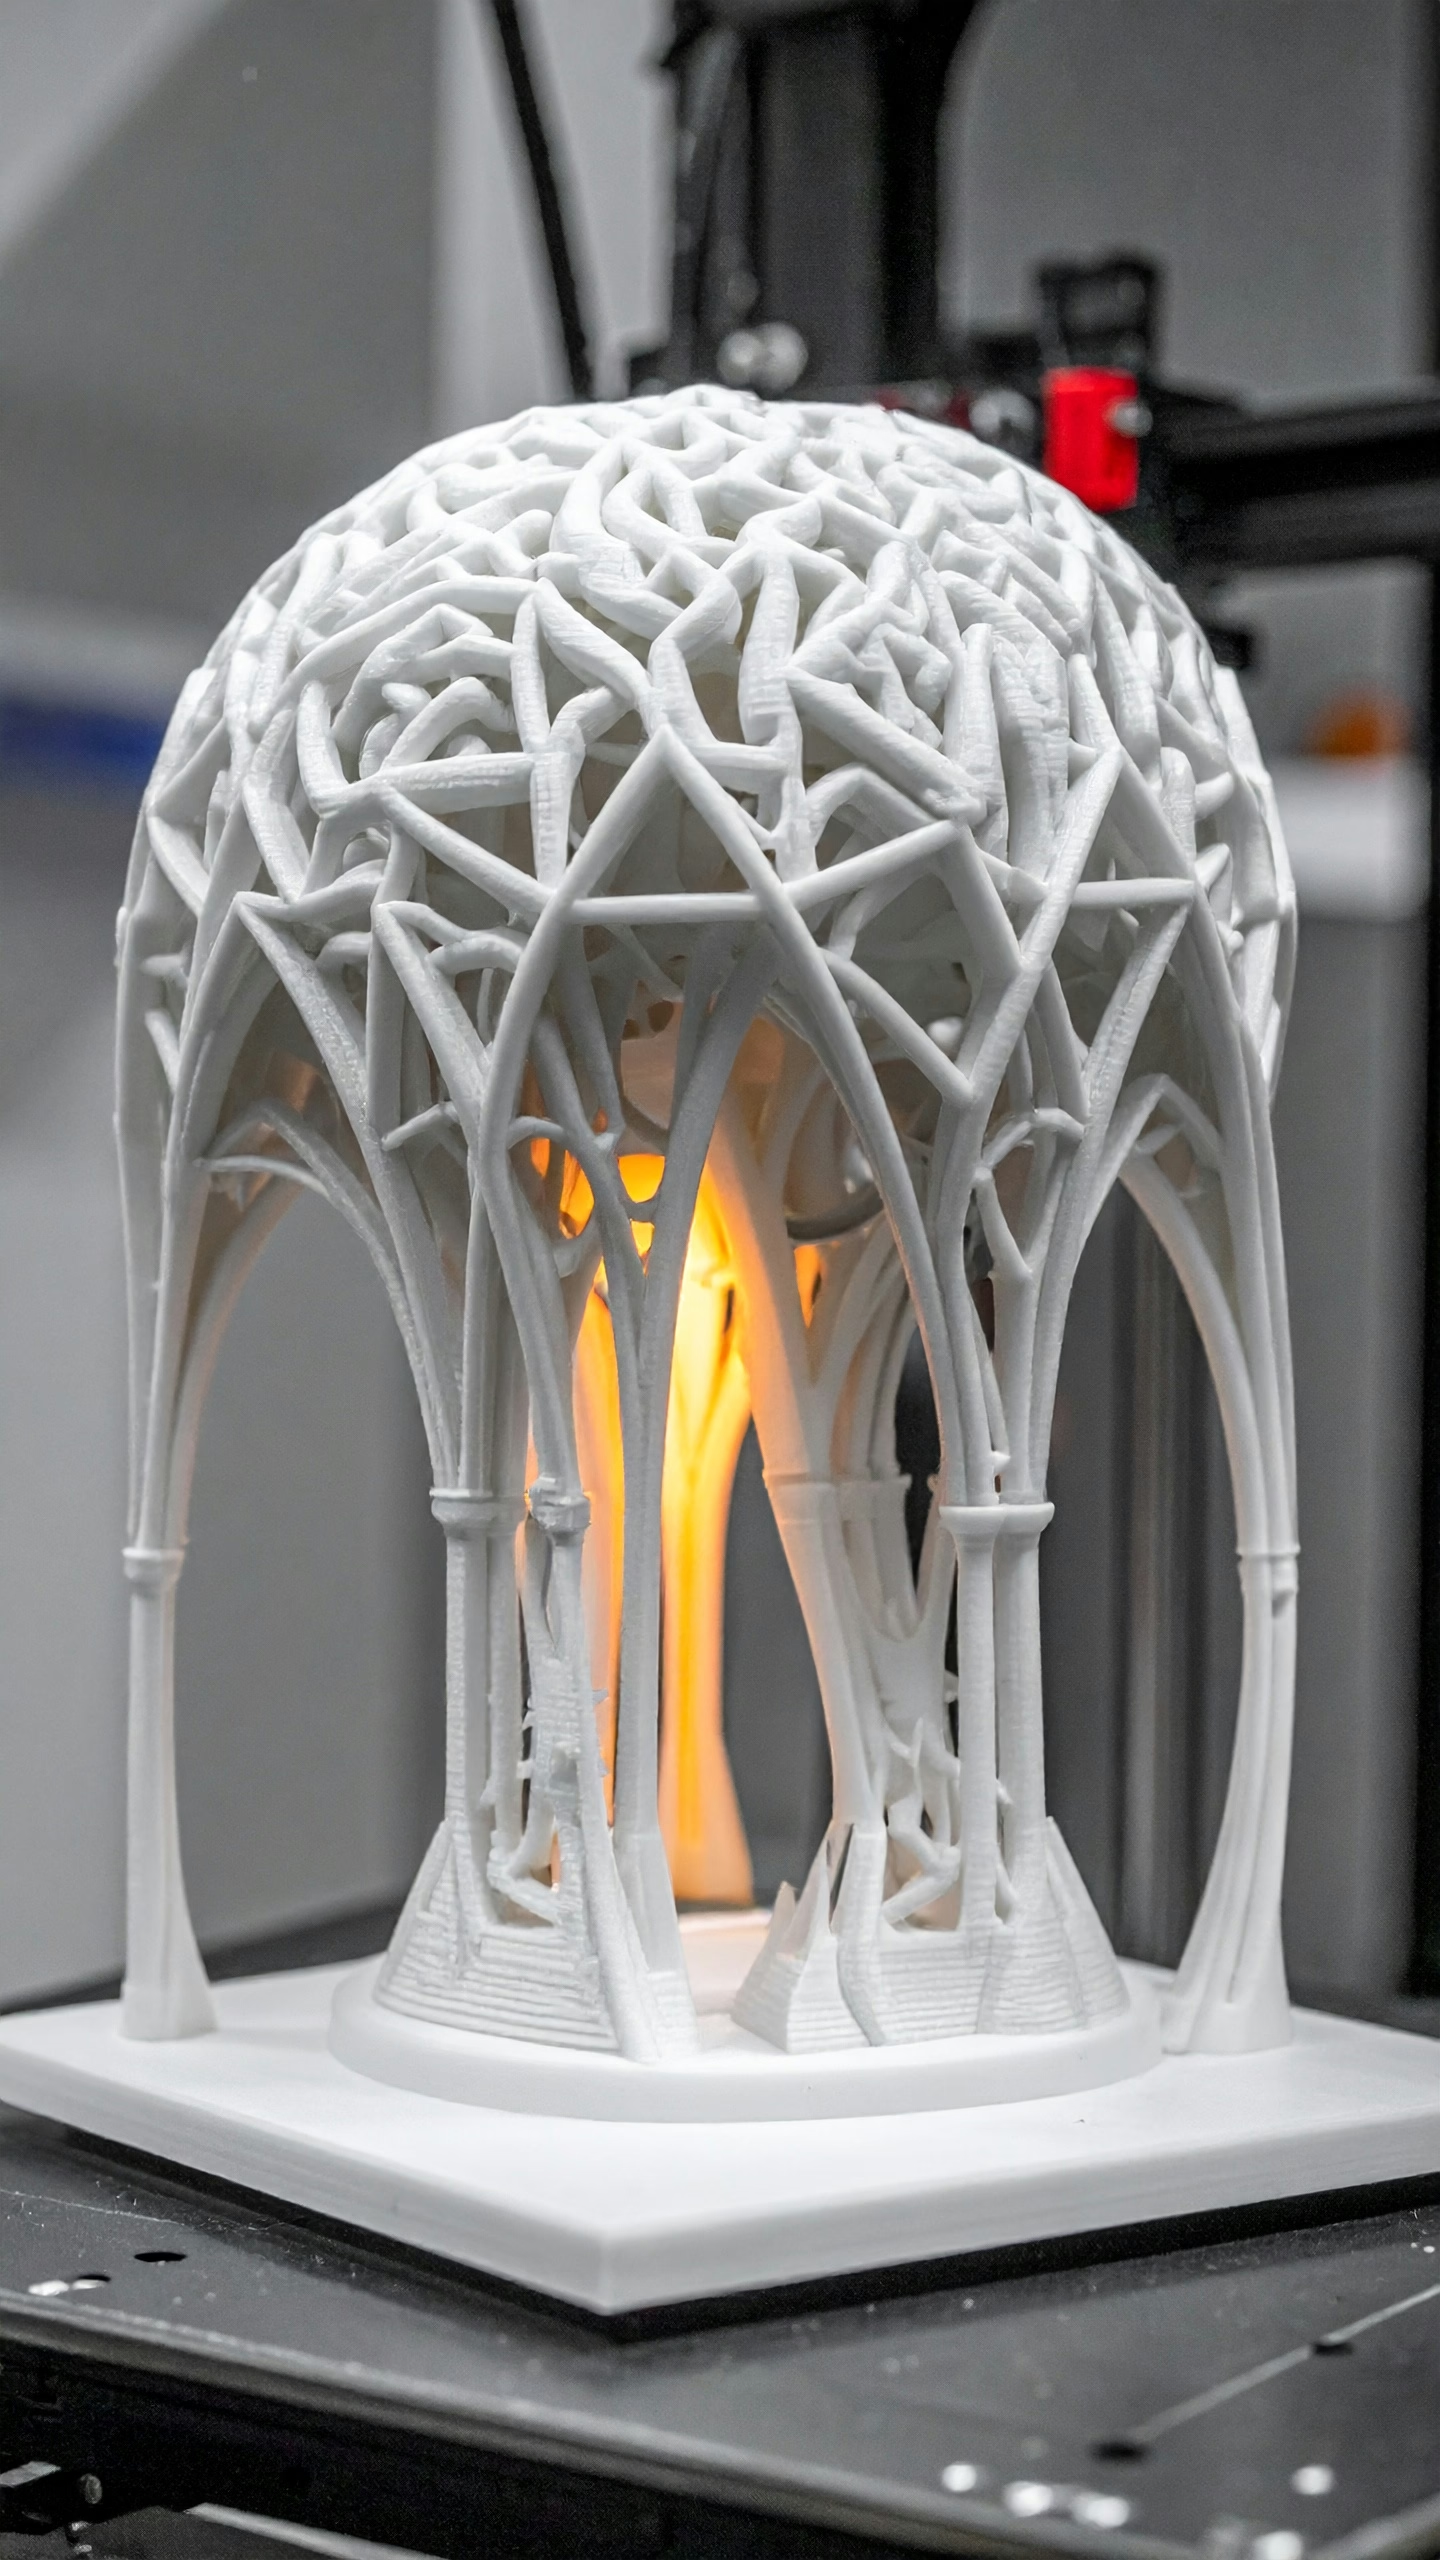
A 3D-printed lamp with intricate lattice design illuminates softly
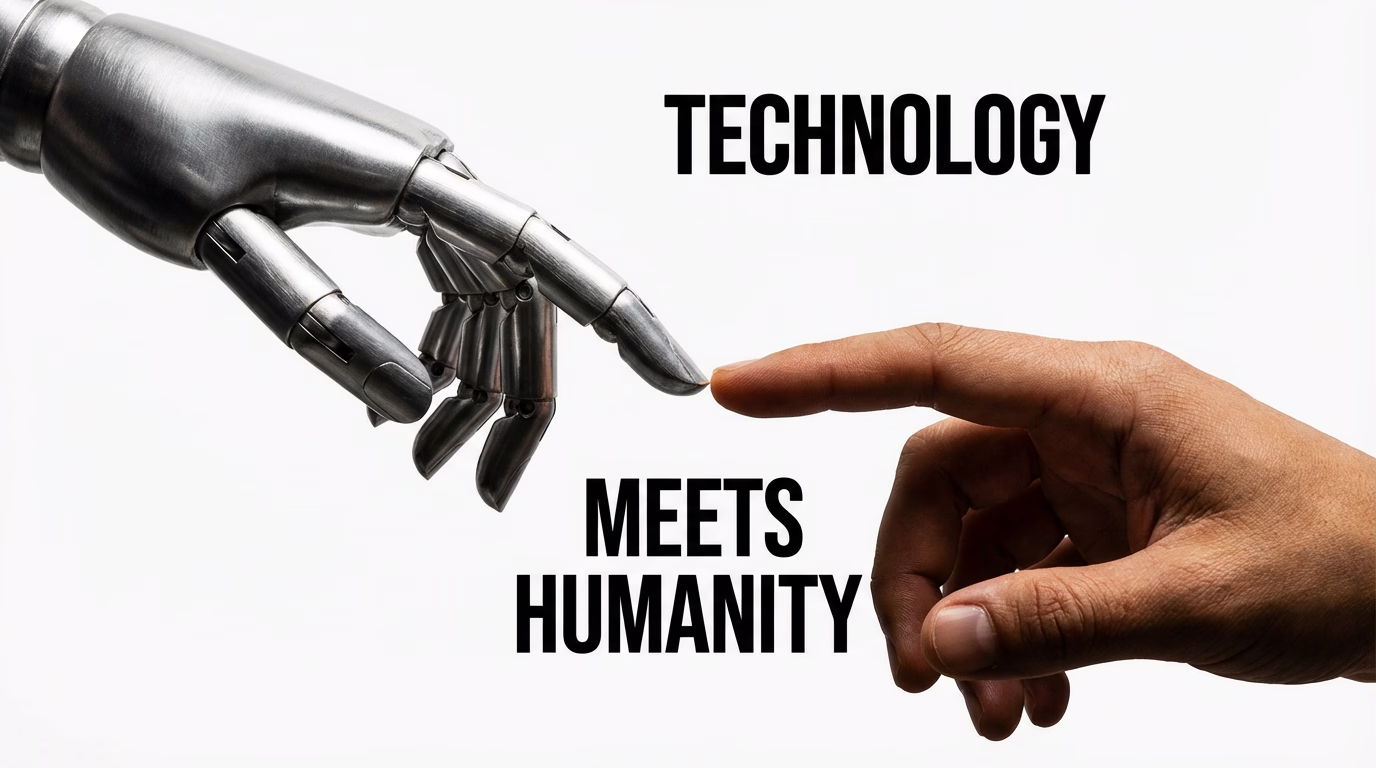
A robotic hand reaching out to touch a human finger symbolizes the fusion of technology and humanity
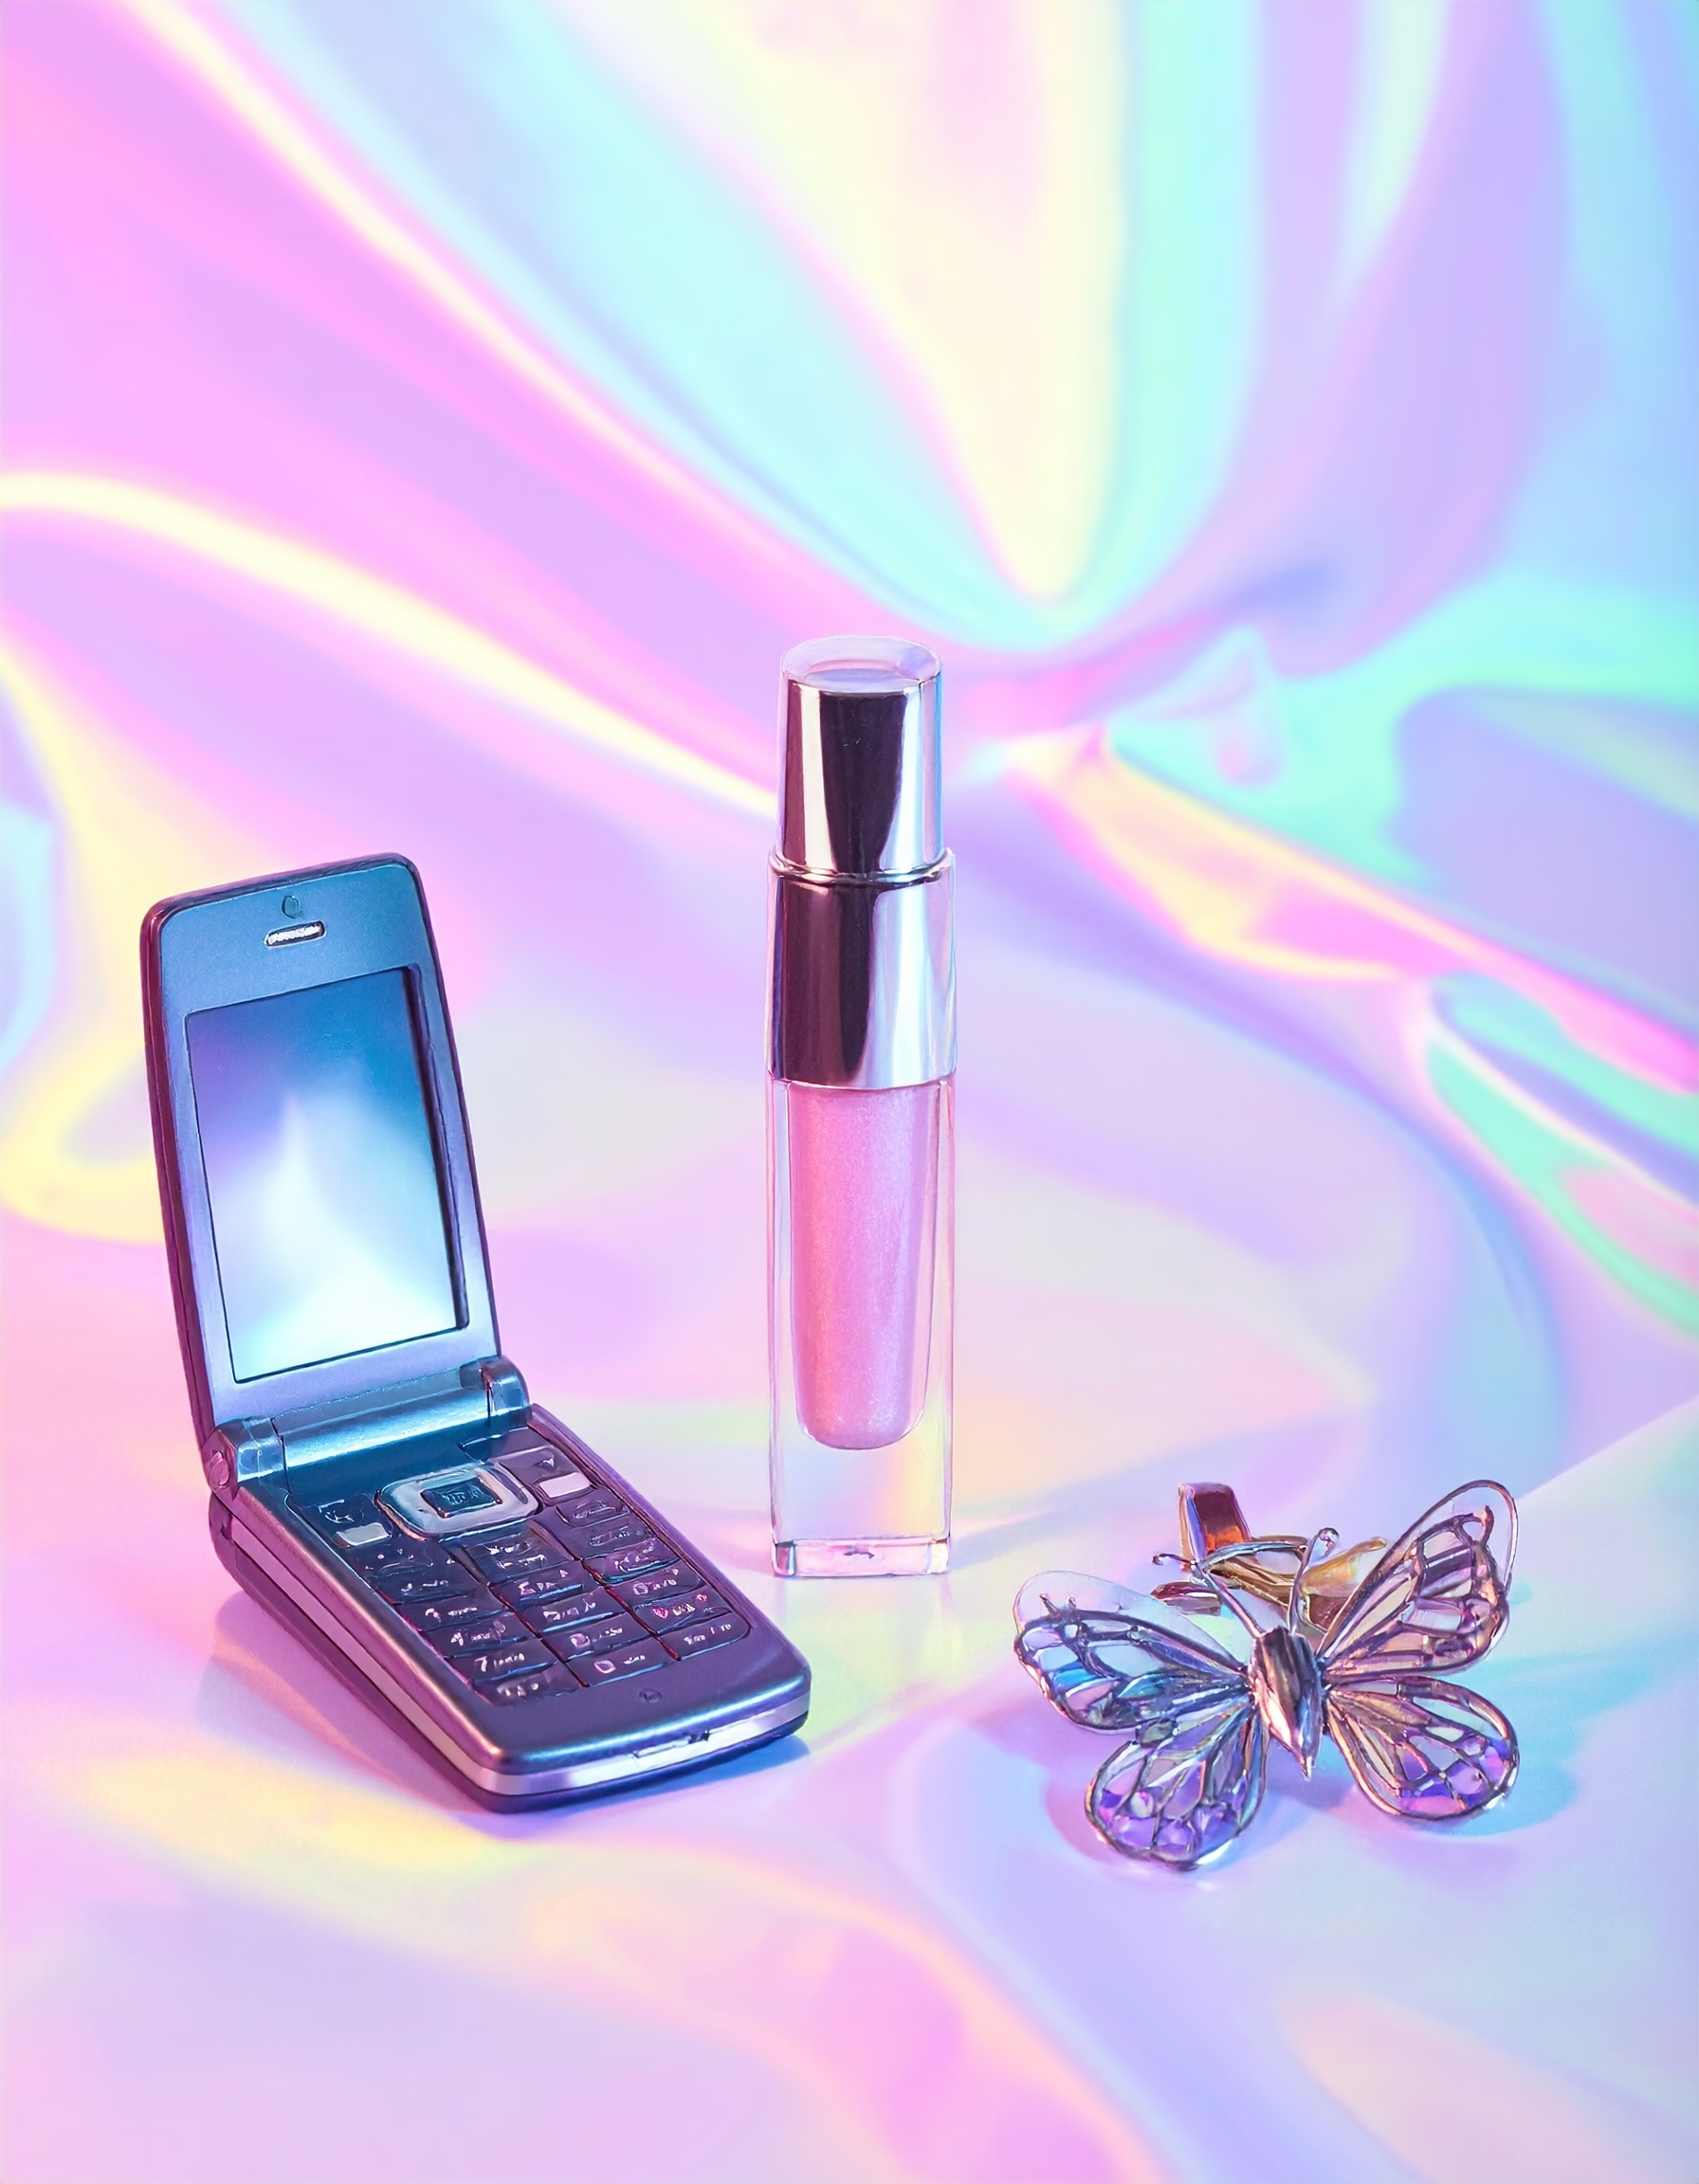
A flip phone, perfume bottle, and butterfly accessory rest on a pastel iridescent background
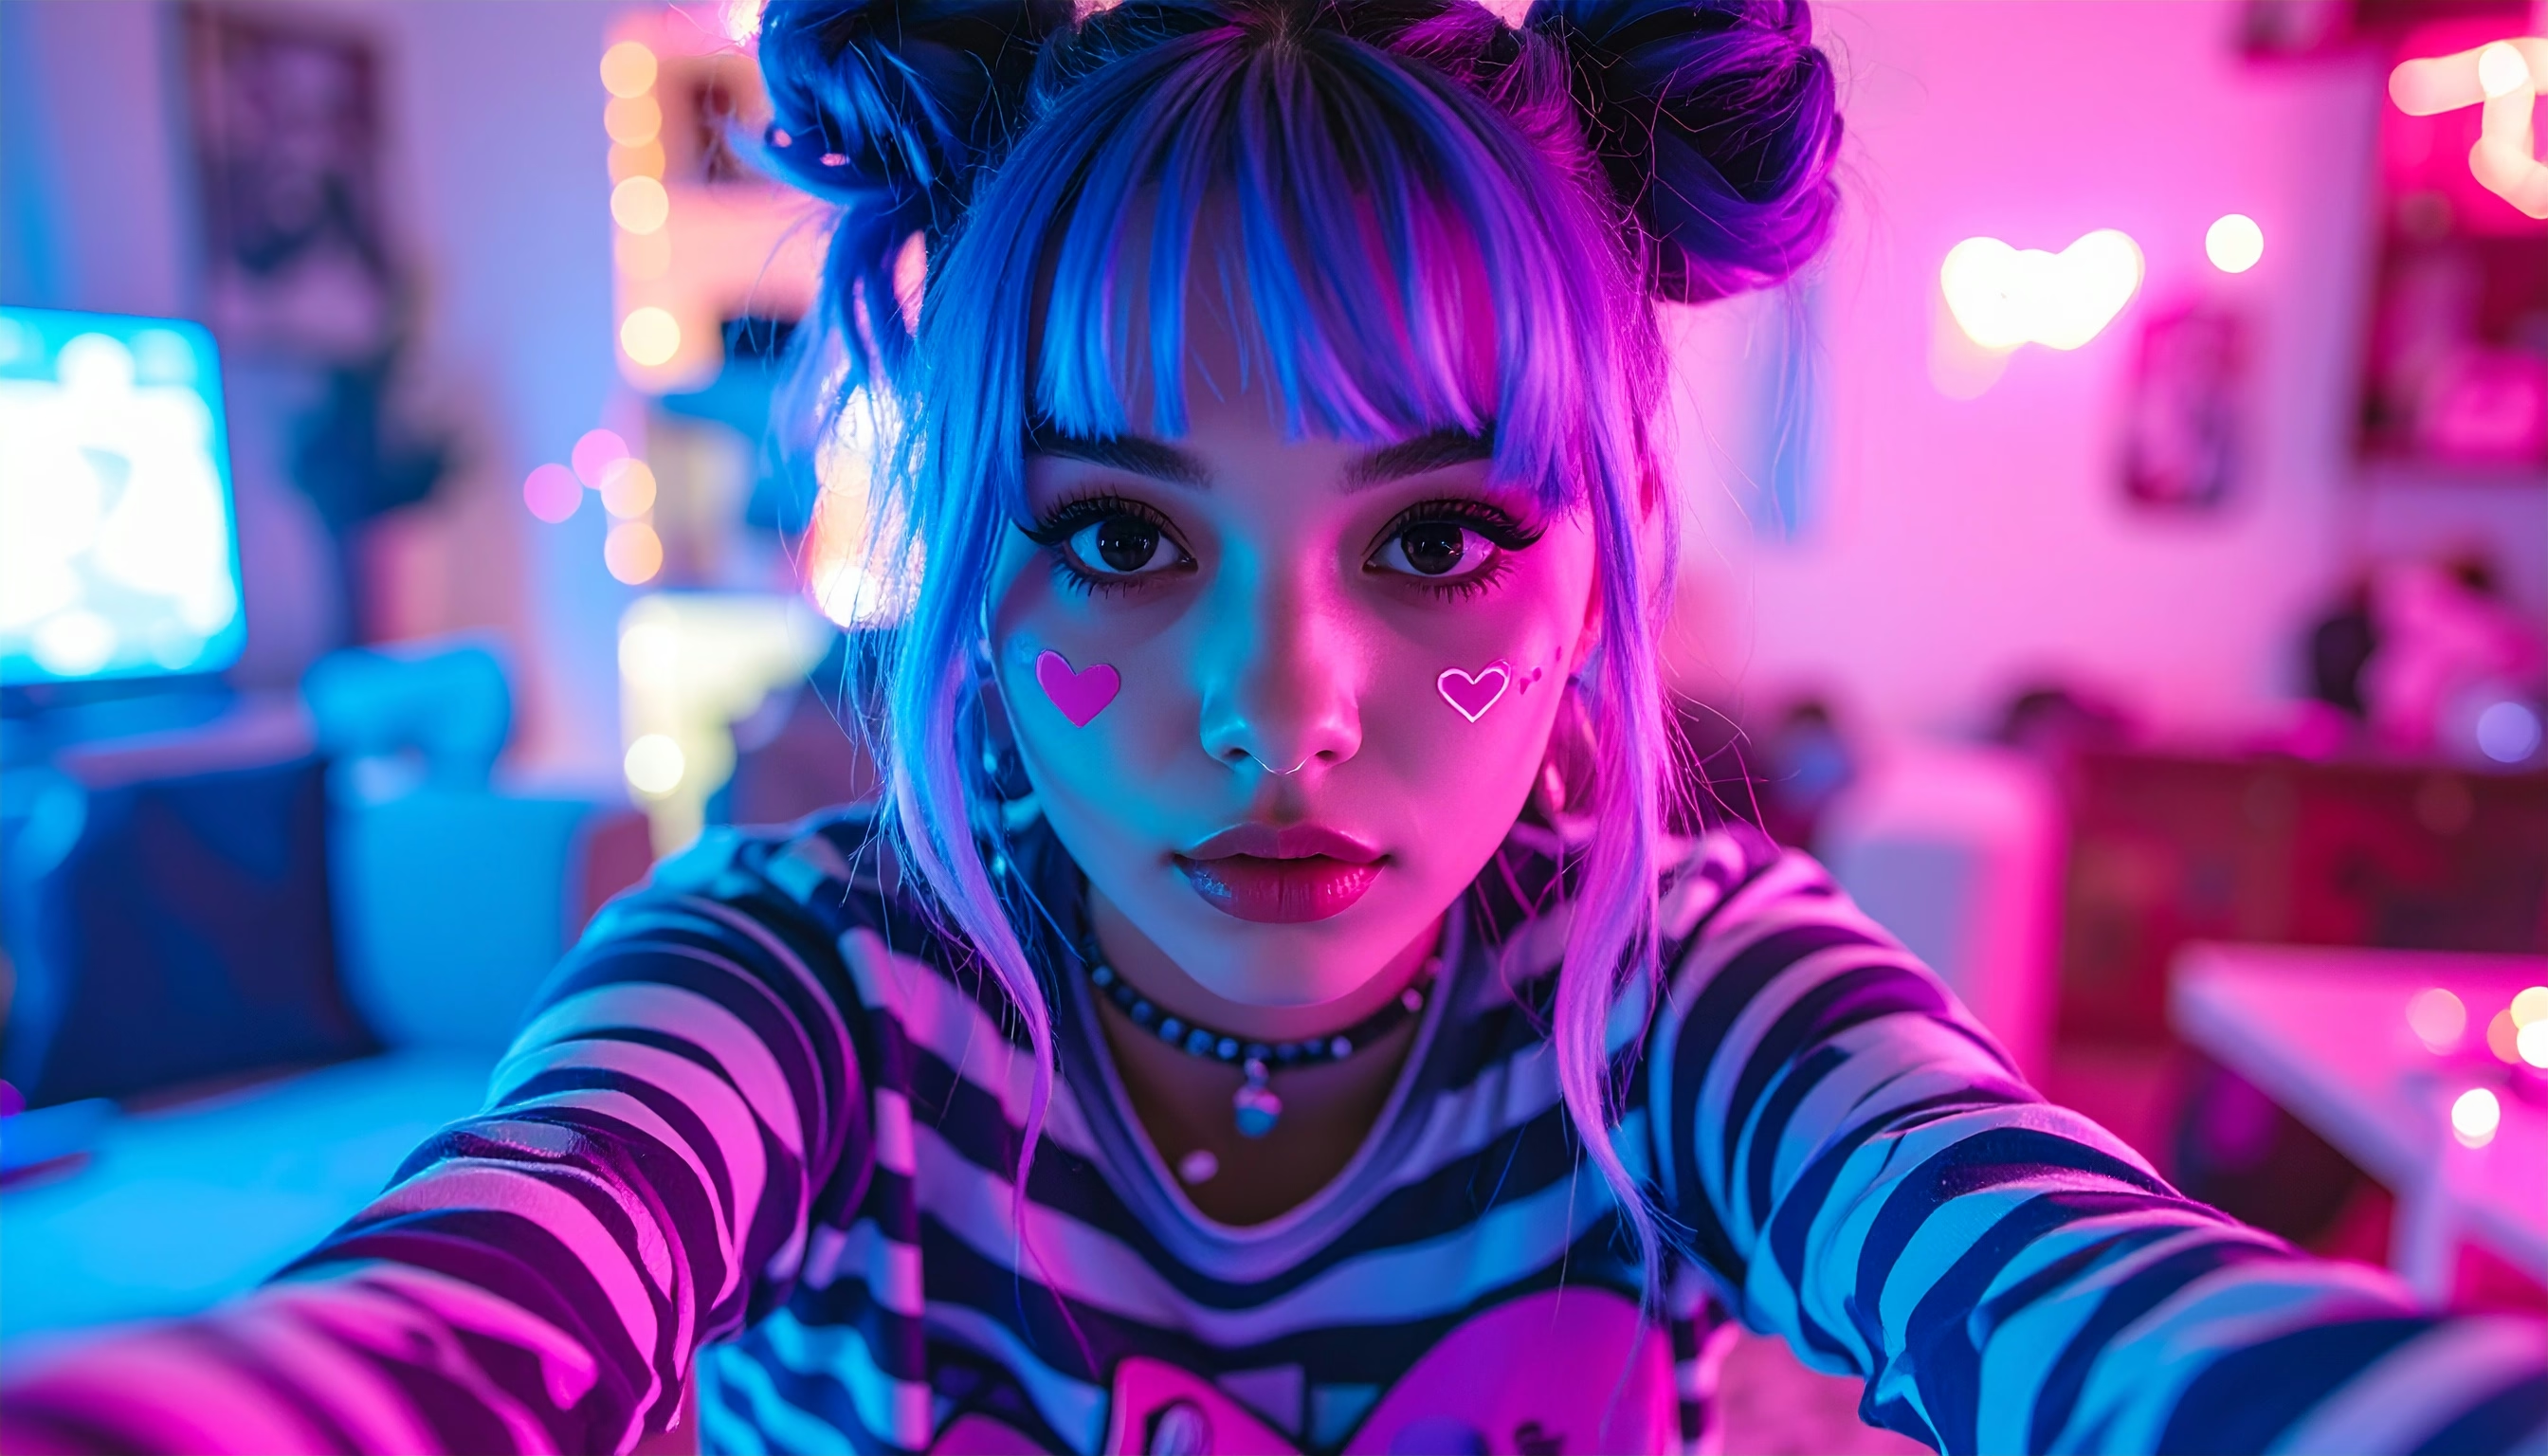
A young woman with vibrant hair stands in a neon-lit room, capturing a selfie
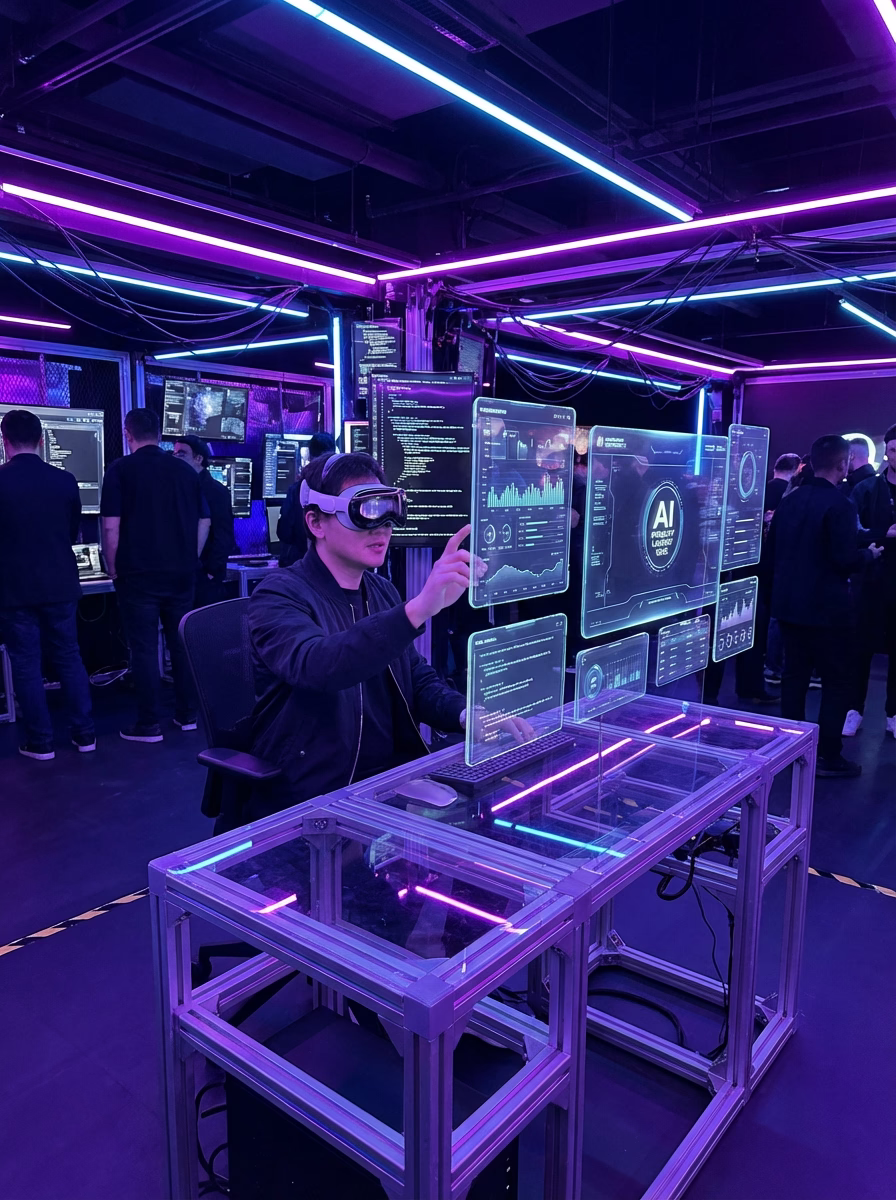
A man in a tech-driven environment interacts with futuristic digital screens
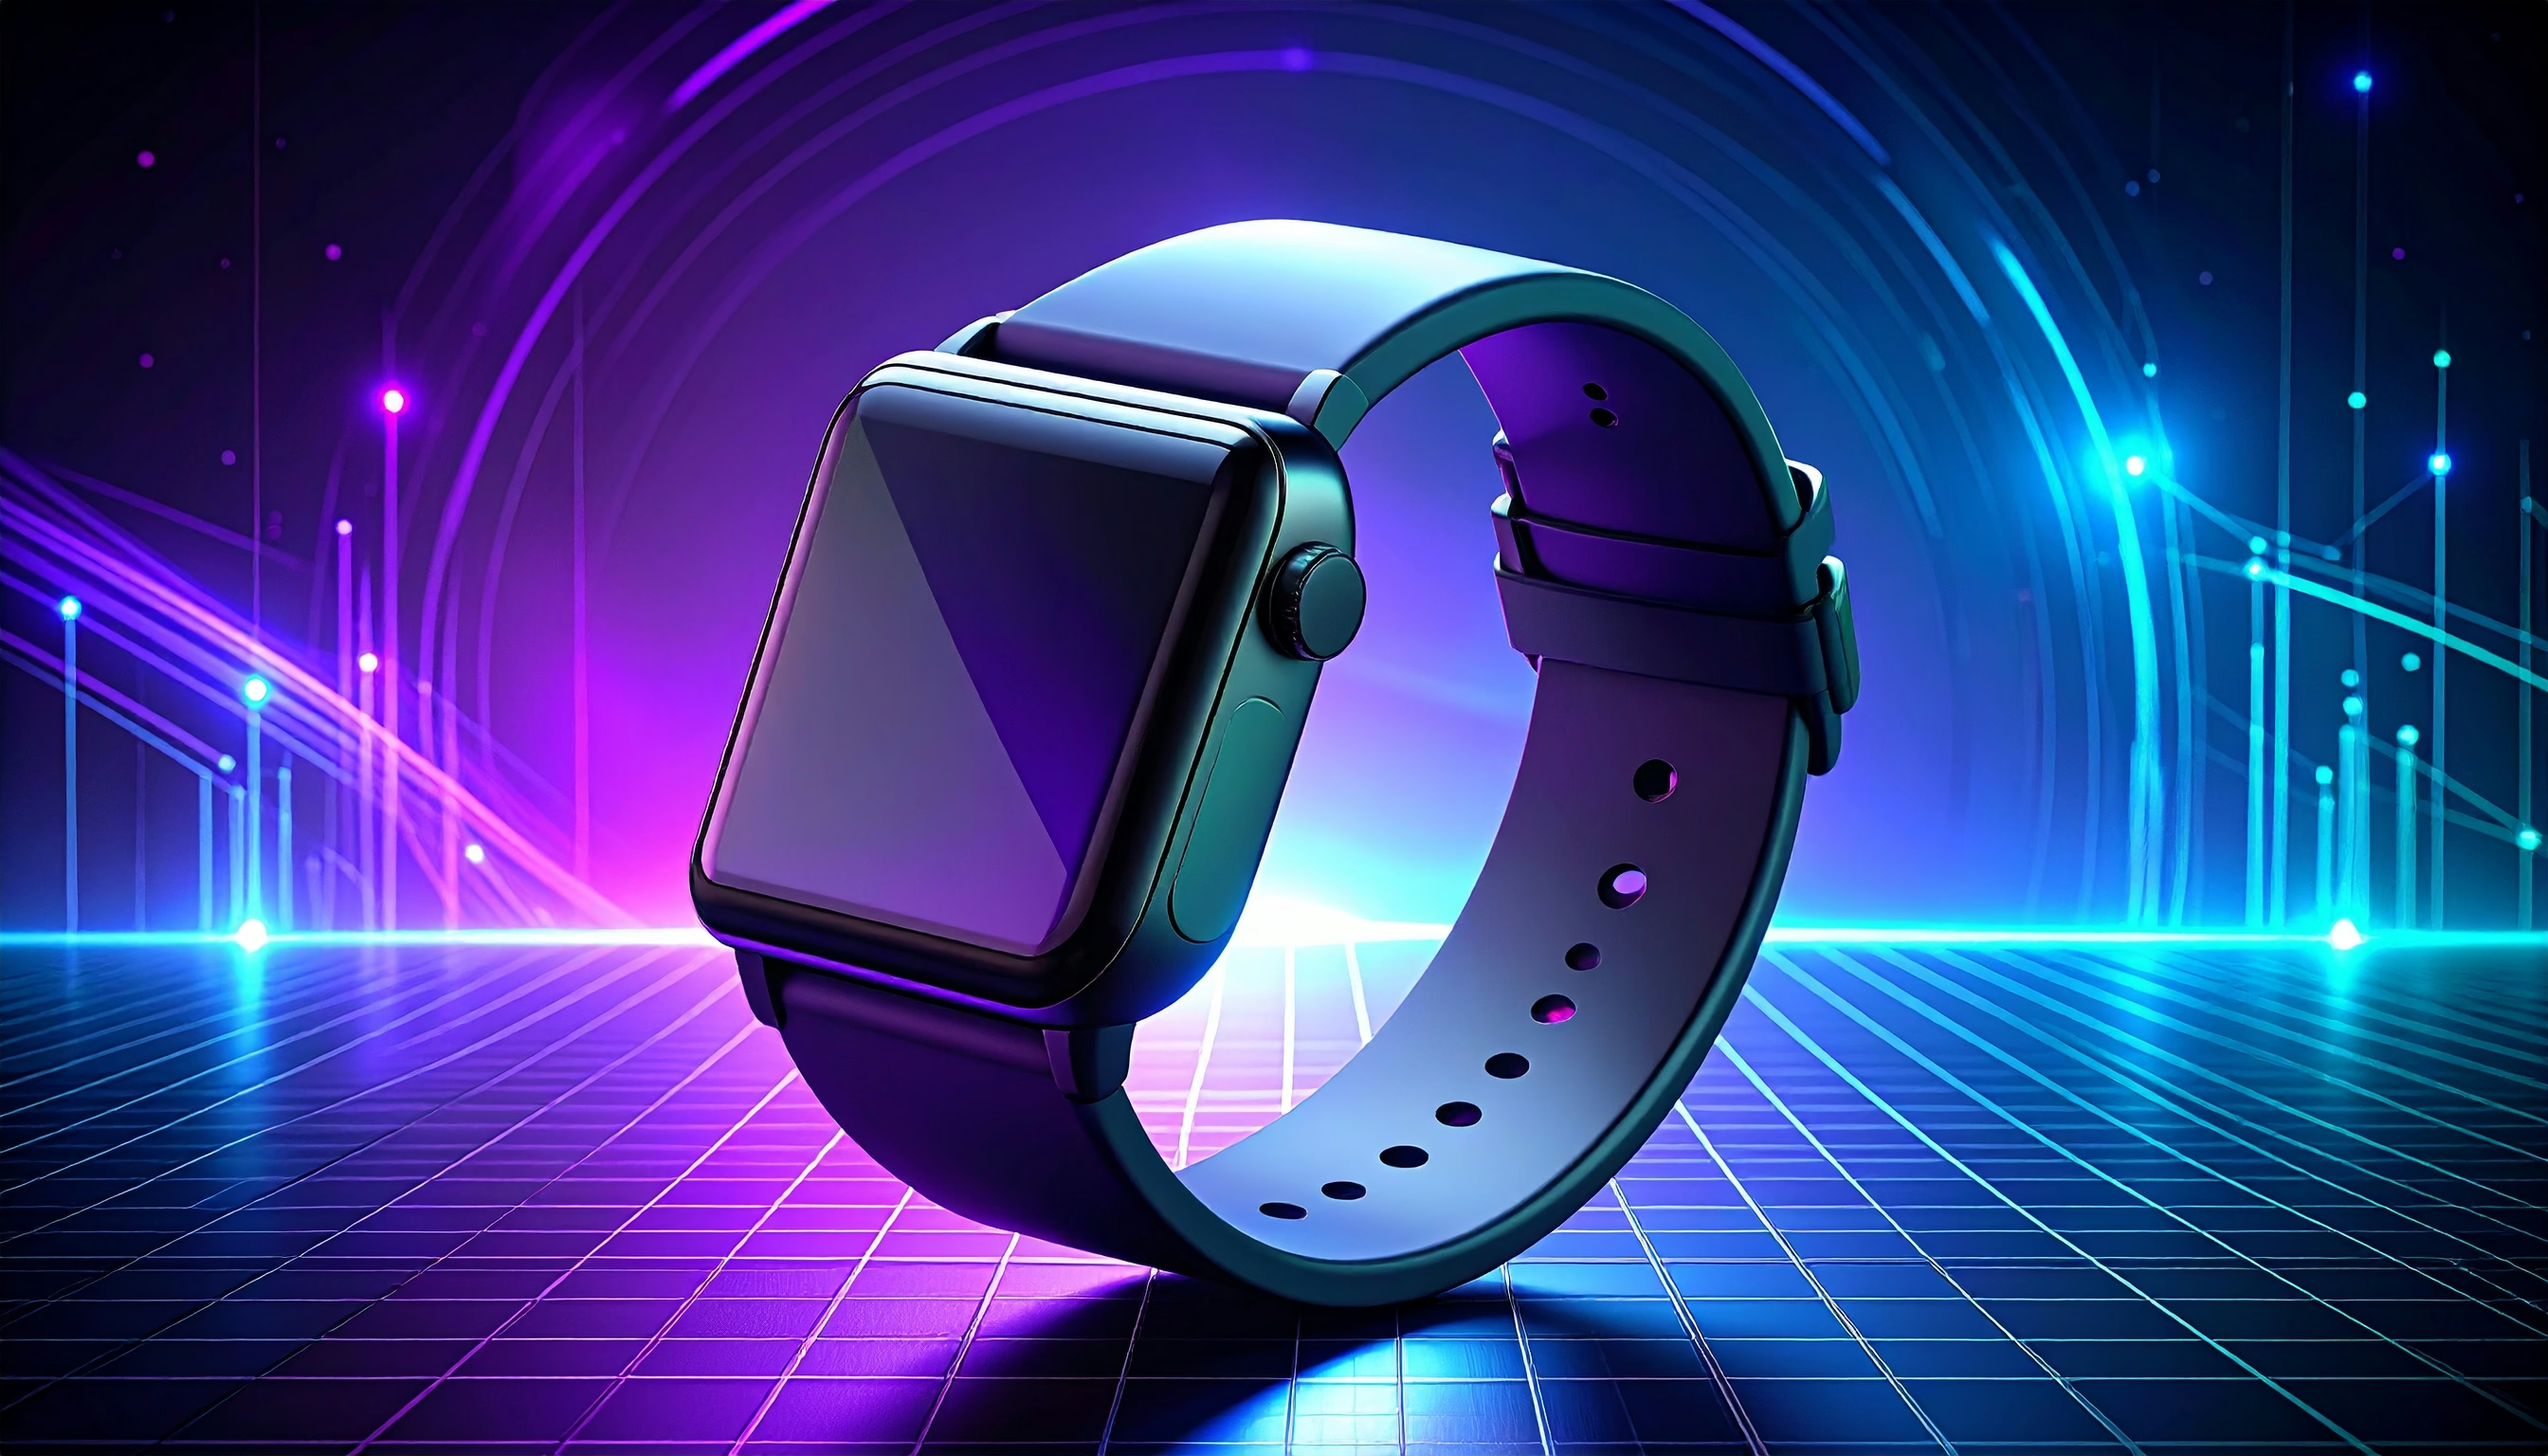
A sleek smartwatch with a modern design is displayed against a vibrant digital background
Frequently Asked Questions
What does this image represent?
Ideal for presentations and reports, it conveys growth and progress effectively. The 3D bars in shades of blue and purple create a dynamic and engaging look. Perfect for business analytics and digital marketing strategies. Its modern aesthetic adds...
What are the main tags for this image?
This image is classified with the tags: bar graph, data visualization, neon colors, 3D design, futuristic.
What is the main theme of this image?
The main theme is "data".
Is this a high-quality image?
Yes, this is a high-quality image with 2688×1536 pixels and was classified with 95% confidence by our AI.